Scatter plot maker generates the scatter plot of the two equal data sets to analyze the relationships of data variables. The first data set is used for the X-values and the second for the Y-values.
This scatter plot generator makes an accurate scatter graph by highlighting the data point values with dots and showing the label for “X & Y axis”. The plot generated by our scatter plot graph maker helps to visualize data patterns, spot trends, and interpret correlations between the two variables.
What is a Scatter Plot?
A scatter plot is a type of graph that visualizes the relationship between two data sets on a two-dimensional plane and uses dots to highlight the data point values. Each dot’s position shows according to the corresponding values of each data point for the horizontal (X) and vertical (Y) axes.
The dot’s positions show the trends or separation of the data points. A scatter plot is also known as a scatter chart or scatter graph. Sometimes called XY-scatter plot, XY graph, or XY chart because it shows the data values on the XY-plane.
How to Make a Scatter Plot?
For the quick scatter graph, use our scatter plot maker which creates the scatter chart for any data set values in seconds. But to create a scatter plot graph with the manual method follow the below realistic steps:
- Collect Data: Collect the values of two data sets and set the “X & Y” values according to independence or dependence on the data.
- Make Pair: Now, make the ordered pair (x, y) by taking the “x” from “X-set” and “y” from “Y-set”.
- Label Axes: Label the values in the XY-plane for “X” & “Y” and label the “X-axis & Y-axis”.
- Draw Points: Finally, plot the point for each data pair where the “X and Y” values intersect on the graph.
- Analyze Trends: Now, examine the scatter plot to identify the separation of data, cluster points, correlations, or outliers of the given data sets.
To understand the above steps see the below scatter plot example.
Scatter Plot Example
Here we perform the example with detailed steps, in these create a scatter plot by using the manual steps. The detailed steps of example help to understand how to make a scatter plot.
Example: Create a scatter plot of the studied hours and test scores for the survey of “5” students. The data are given in below table:
Study hours (X) | 2 | 4 | 5 | 7 | 4 |
Test scores (Y) | 50 | 55 | 95 | 70 | 85 |
Solution:
Step 1: Collect the data.
Data Set X = {2, 4, 5, 7, 4}
Data Set Y = {50, 55, 95, 70, 85}
Step 2: Make the ordered pair of all data values.
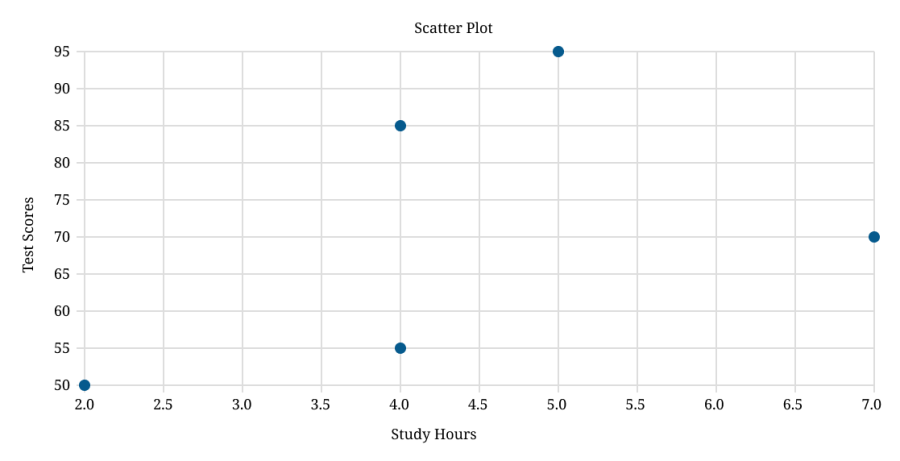
P1 = (2, 50), P2 = (4, 55), P3 = (5, 95), P4 = (7, 70), P5 = (4, 85)
Step 3: Draw the XY-plane and label the axis values.
Take Study Hours along “X-axis”
Take Test Scores along “Y-axis”

Step 4: Plot the data point of each pair and place a dot where ordered pair values intersect.

Step 5: Analyze the scatter plot and look for trends.
This data gives a positive correlation and shows more study hours are related to higher test scores.
Frequently Asked Question
When to use a scatter plot?
The scatter plot graph is used to compare two variables that have a relation together. It is used to identify correlations between two variables, patterns or clusters, and outliers of data sets. This visual representation is useful in research, business, and scientific analysis to interpret data relationships.
What are clusters and outliers?
Clusters are groups of data points that are shown close together in a scatter graph while outliers are those points that are shown far from all points of data.
What are the types of Scatter Plot Graphs?
Scatter charts are categorized into three types based on the nature of the relationship between the variables. The Positive Correlation (Points trend upward), Negative Correlation (Points trend downward), and No Correlation (Points are scattered randomly).
What types of data can be put in a scatter plot maker?
To use our scatter plot generator put any type of numerical data that have a relation together and have two type data sets. Our scatter plot calculator generates the scatter graph and gives the download feature to download the chart as a PNG or PDF file.
What is a line of best fit in a scatter plot?
A line of best fit is also called a trend line. It shows the trend in a scatter plot by going through the middle of the data and being able to close as many points as possible. This line helps in predicting types of graphs and shows the types of correlation between the variables.


