Outlier Calculator is a statistical tool that helps to calculate the outliers of any dataset by using the interquartile range (IQR) method.
This outliers calculator gives the first quartile, third quartile, lower outlier boundary, and upper outlier boundary values for proper analysis. It also provides step-by-step solutions for every data set that helps to understand the calculation process of outliers.
What is an Outlier?
Outlier is a data point that significantly deviates from the separation of all datasets. It lies at an abnormal distance from the values of a random sample or population data. Randomly, outliers are extremely high or low values of any data.
Outliers are used in data analysis to indicate errors and draw accurate conclusions from any dataset. It helps to analyze data carefully and highlight meaningful insights or rare phenomena.
How to Find the Outlier?
There are several methods to calculate outliers manually. But here we discuss the 4-commons method from all of them:
- Interquartile Range (IQR) Method
- Sorting Method
- Visualization Method
- Z-score Method
Interquartile Range Method (IQR)
Interquartile Range (IQR) is the most used method to find the outlier of any data. IQR is the statistical technique that finds the range between the first quartile (Q1) and the third quartile (Q3) of a dataset.
The IQR value is used in the fences formula to evaluate the outlier of given data. Generally, the outliers are those data values that fall outside of a given range. To find the exact value see the below steps.
Steps to find outliers by IQR:
To find the outlier by IQR formula follow the below simple steps:
- First, arrange data in ascending order.
- Find the quartiles: Q1 (first quartile) and Q3 (third quartile).
- Calculate the IQR: IQR = Q3 – Q1
- Now, evaluate the lower outlier boundary and upper outlier boundary by using the IQR value.
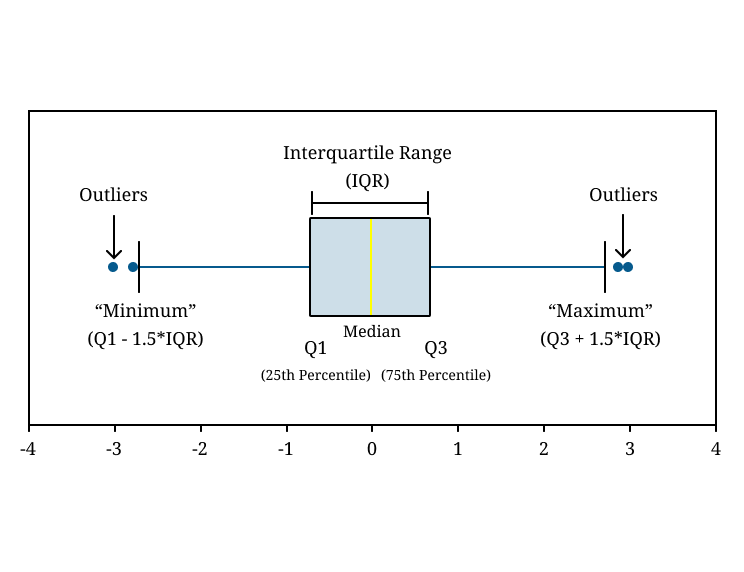
Lower Outlier Boundary = Q1 – 1.5 * IQR
Upper Outlier Boundary = Q3 + 1.5 * IQR
- Analyze, if the values are below the lower fence or above the upper fence then considered an outlier.

Example
Calculate the outlier of given data using IQR technique: {10,12,14,18,22,24,30,35,40}.
Solution
Step 1: First arrange the data values from smallest to largest.
Ordered data = {10, 12, 14, 18, 22, 24, 30, 35, 40}
Step 2: Now, calculate the Q1 and Q3.
For “Q1”:
Q1 = (n + 1)/4 = (9 + 1)/4-term = 2.5-term
Thus, the value is not whole then take values at positions “2” and “3” from ordered data.
Q1 = (12 + 14)/2 = 13
For “Q3”:
Q3 = 3(n + 1)/4 = 3 (9 + 1)/4-term = 30/4 -term= 7.5-term
Since the term value is not a whole number, then take “7” & “8” position values and find the mean.
Q3 = (30 + 35) / 2 = 32.5
Step 3: Evaluate the interquartile range by taking the difference of “Q1” from “Q3”.
IQR = 32.5 - 13
IQR = 19.5
Step 4: Now evaluate the lower fence boundary and upper fence boundary by their formula.
Lower Fence = Q1 – 1.5 x IQR = 13 - (1.5 x 19.5) = -16.25
Upper Fence = Q3 + 1.5 * IQR = 32.5 + (1.5 x 19.5) = 61.75
Step 5: Now, detect the outlier values to compare the fences.
Note that, there is no value before or after the fence values.
Thus, Outlier = none
Sorting Method
It is one of the easiest ways to find outliers, in this arranged data set values from lowest to highest. The minimum and maximum value of data is normally called the outlier.
But sometimes these values are not outliers, then this method is combined with a box plot or interquartile range (IQR) method for accurate value and perfect analysis.
Steps to calculate an outlier by sorting method:
- Set the dataset in ascending order.
- Identify the extremes (smallest and largest values) from the whole data.
- Label extreme values as outliers.
Example
Identify the outlier from the given data {1800, 15, 9, 16, 13, 12, 7, 16,11}.
Solution
Step 1: Arrange data values in ascending order.
Ordered data = {7,9, 11,12, 13, 15, 16, 1800}
Step 2: Now, compare the values and label the outlier.
Note that, “1800” is the extreme largest number from the given data, then “1800” is the outlier value.
Visualization Method (Box Plot Method)
The visual methods include boxplots, scatterplots, and histograms to identify the outlier. To visualize the outlier values by scatter plot and histogram plot use our scatter plot maker and histogram maker respectively.
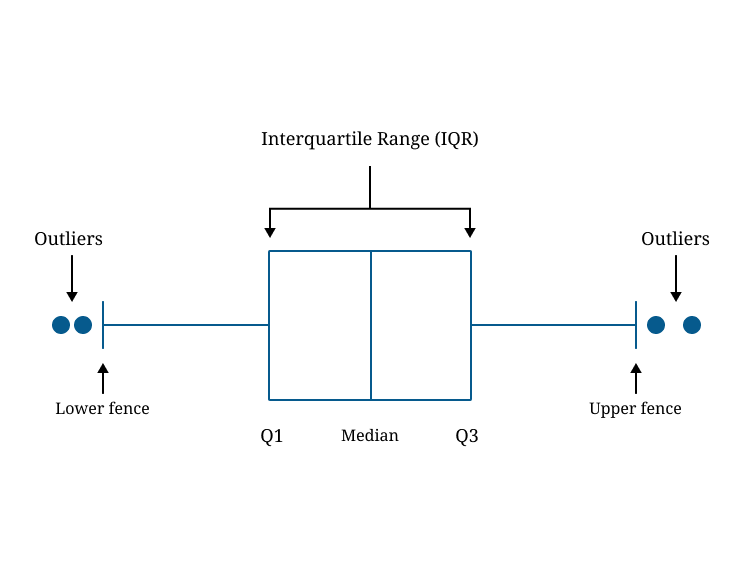
Now, discuss the box plot (whisker plot), this method is used to identify the outlier by graphical data representations. It displays a five-number summary on a single box by including quartiles, median, and potential outliers values.
How box-plot Works:
- The box represents the IQR with the middle line as the median.
- The whiskers extend to 1.5 times IQR to the left of Q1 and right of Q3.
- Points outside the whiskers are supposed outliers.

Z-Score Method
The Z-score method is a statistical technique that is used to find outliers by using a Z-score formula. The data point is considered to be an outlier if the Z-score is more than a specific limit, usually 3 or -3.
The z-score formula used for outlier is stated as:
Z = (x - μ) / σ
Where: “x” is the data point, “μ” is the mean, and “σ” is the standard deviation of the dataset.
Steps to Calculate outliers using Z-score method:
- Calculate the dataset’s mean (μ) and standard deviation (σ).
- Find the Z-score for each data point using the formula. For quick z-score use our z-score calculator.
- Compare Z-scores to the threshold (e.g., ∣Z∣>3).
- Analyze, those data points whose z-score is above or below the threshold, considered outliers.
Example
Find the outlier using the Z-score method {10, 12, 15, 18, 22, 24, 100}.
Solution
Step 1: Calculate the mean of data by using the mean formula.
Mean (μ) = (10 + 12 + 15 + 18 + 22 + 24 + 100) / 7 = 28.71
Step 2: Now, Find the standard deviation of the given sample data
First, find the squared differences from the mean:
Sum of squared differences = 6068.56
Put the values in the standard deviation formula.
σ = √(6068.56/7) = √867.65 = 29.45
Step 3: Compute the Z-Scores for all values of data.
| Data Point (x) | Z-Score Calculation | Z-Score |
| 10 | (10 - 28.71) / 29.45 | -0.64 |
| 12 | (12 - 28.71) / 29.45 | -0.57 |
| 15 | (15 - 28.71) / 29.45 | -0.47 |
| 18 | (18 - 28.71) / 29.45 | -0.37 |
| 22 | (22 - 28.71) / 29.45 | -0.23 |
| 24 | (24 - 28.71) / 29.45 | -0.16 |
| 100 | (100 - 28.71) / 29.45 | 2.41 |
Step 4: Finally, Identify the outlier value that is less or greater than the z-bounds.
Note that, all Z-scores are within the |Z| ≤ 3, except for 100. Thus, “100” is the outlier of the given data with z-score “2.41”.
To verify the results of the outlier value of the z-score method using our above outlier calculator that provides accurate results.
Frequently Asked Questions (FAQs)
What are fences in the IQR method?
Fences are boundaries that define the range of normal data and give the bounds to identify the outlier. The points outside these boundaries are known as outliers or potential outliers.
Can outliers be more than 1?
Yes, a dataset has multiple outliers. The number of outliers depends on the dataset and the method used to identify them.
Do I need to preprocess data before using an outlier calculator?
No, By using our outlier calculator not rearrange or preprocess any data. Simply input your dataset in the given input as a comma-separated list and get accurate results. It computes outliers instantly and arranges data in ascending order.


