What is a Five-Number Summary?
A five-number summary is a set of descriptive statistics that summarizes the distribution of a dataset. The five statistics that comprise the summary are the minimum value, the first quartile (Q1), the median, the third quartile (Q3), and the maximum value.
Table for a five-number summary:
Value | Description |
Minimum | The minimum value is the smallest value in the dataset. |
Q1 | The first quartile (Q1) is the value that separates the lowest 25% of the data from the highest 75% of the data. |
M (Median) | The median is the value that separates the lowest 50% of the data from the highest 50% of the data. |
Q3 | The third quartile (Q3) is the value that separates the lowest 75% of the data from the highest 25% of the data. |
Maximum | The maximum value is the most significant value in the dataset. |
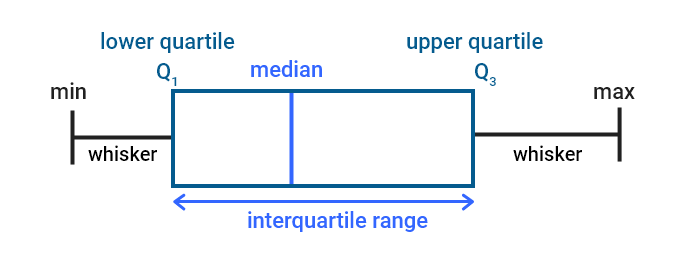
The five-number summary can be used to create a box-and-whisker plot, which is a graphical representation of the distribution of the data. The plot consists of a box that represents the interquartile range (IQR) and whiskers that extend to the minimum and maximum values.

In the above picture box,
- The plot spans the range between the first and third quartiles (Q1 and Q3).
- The median is represented by a line inside the box.
- The length of the box represents the spread of the middle 50% of the data, while the whiskers represent the range of the data outside of the box.
How to Calculate the Five-Number Summary by hand?
Calculating the by hand or with a calculator. Here are the steps to follow:
- Sort the data in ascending order.
- Calculate the median (M) of the dataset.
- Divide the dataset into lower and upper halves; exclude the median from both if odd number of values.
- Calculate the median of the lower half of the dataset. This is the first quartile (Q1).
- Calculate the median of the upper half of the dataset. This is the third quartile (Q3).
- The minimum value is the smallest value in the dataset.
- The maximum value is the largest value in the dataset.
Example:
Suppose we have the following dataset: 5, 2, 7, 11, 9, 12, 18, 15, 21.
- Arrange the data in ascending order: 2, 5, 7, 9, 11, 12, 15, 18, 21.
- Calculate the median: 11.
- Divide the dataset into two halves:
- Lower half: 2, 5, 7, 9.
- Upper half: 12, 15, 18, 21.
- Calculate Q1: As the middle is odd then the median will be the average of two middle values (5+7)/2 = 6, so Q1 = 6.
- Calculate Q3: The median of the upper half is (15+18)/2 = 16.5, so Q3 = 16.5.
- The minimum value is 2.
- The maximum value is 21.
Therefore, the five-number summary for this dataset is:


