Correlation Coefficient Calculator
The correlation coefficient calculator uses Pearson’s method to find the correlation. You will find each step that you will need in the results. Lastly, this tool also analyzes the result and tells how strong a correlation exists between two data sets.
What is the correlation coefficient?
It tells you the nature of the relation between two different sets. The absolute correlation value indicates the strength of this relationship while the positive or negative sign indicates the direction of this relationship.
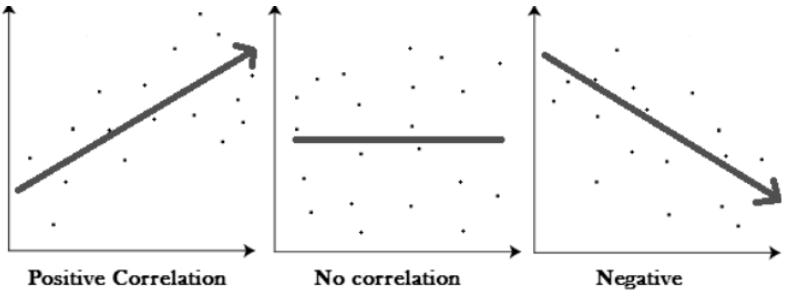
Scatter plots are also used to get an idea of possible connectivity between two variables. Usually, one variable is plotted against the x-axis while the other is against the y-axis. It is then observed if a linear pattern exists.

The value ranges between +1 and -1. A positive relation will mean one set affects the other set directly while a negative relation means they affect inversely. Zero correlation would mean they are not connected at all.
Correlation coefficient formula:
The formula used for Pearson’s correlation coefficient is

Where
- rp refers to Pearson’s correlation.
- cov(x,y) is the covariance of x and y.
- sx is the standard deviation of x.
- sy is the standard deviation of y.
How to find the correlation coefficient?
The size of the data set is directly related to the reliability of the correlation coefficient value. A larger set is likely to give a more accurate relation status. The steps to find covariance are:
- Find the covariance between both variables. Use a covariance calculator.
- Calculate the separate standard deviation of both as well.
- Multiply the deviations.
- Divide covariance with it.
- Analyze the result.
Example:
Set X = 10,34,23,54,9
Set Y = 4,5,11,15,20
Solution:
Step 1: Find the covariance of x and y.
Calculating mean for x and y.
Xmean = 10+34+23+54+9 / 5
= 130/5
=26
Ymean = 4+5+11+15+20/5
= 55/5
= 11
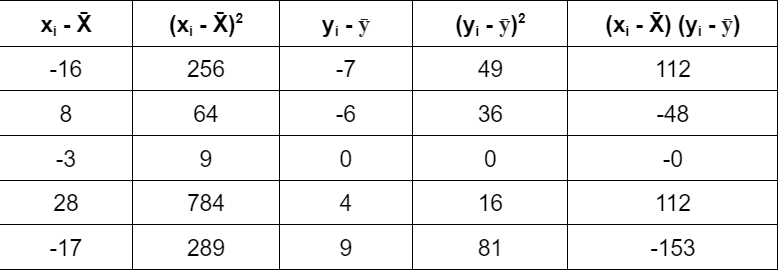
Find covariance.

∑ (xi - X̄) (yi - ȳ) = 23
Step 2: Find the standard deviation of x.
= √ ∑ (xi - X̄)2
Taking the data for the sum of squares from the previous step,
= √ (256 + 64 + 9 + 784 + 289)
= √ (1402)
Step 3: Find the standard deviation of y.
= √ ∑ (yi - ȳ)2
Taking the data for the sum of squares from the first step,
= √ (49 + 36 + 0 + 16 + 81)
= √(182)
Step 4: Use the correlation coefficient formula.

= 23 / √ (1402)√(182)
= 23 /505.1376
= 0.0455
Step 5: Analyze.
Since it is greater than 0, the correlation is positive.
Value is 0.04 hence weak correlation.


