What is the Coefficient of Determination?
The coefficient of determination is a measure that predicts the goodness of fit of the model for given data. This measure indicates a number of the values of observed outcomes that matched with the predicted outcomes of a statistical model.
The goodness of fit also indicates the variation of the dependent variable according to the independent variable. It is denoted by “R2” and its value ranges from “0 to 1”.
- “R2=0” means that the independent variable does not produce any variation in the dependent variable.
- “R2=1” shows that the independent variable(s) gives the variation in the dependent variable.
The higher R-squared values represent a good fit of the model that suggests a significant portion of the variance in the dependent variable. While low R2 Indicates a poor fit of the model, it means the model does not explain the variance of data.
Coefficient of Determination Formula
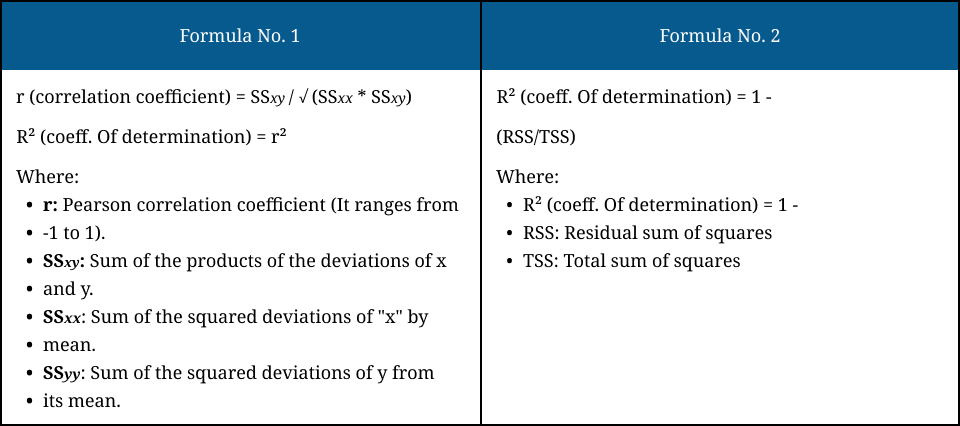
The two formulas are commonly used to find the coefficient of determination of simple linear regression.
- Using the Correlation coefficient formula (r)
- Using the sum of squares or Regression Values

How to Find Coefficient of Determination?
To find the value of coefficient of determination (r-squared value) see the below example. In which we find the r squared value manually by using the coefficient of the determination formula. Moreover, for a quick solution use our coefficient of determination calculator that finds the R-squared value by using the correlation coefficient formula.
Example:
Calculate the coefficient of determination of the given data by using the r-squared value formula.
X: {2,4,3,34,23}, Y: {21,12,3,11,17}.
Calculation:
Step 1: Firstly, we make a table to find the value of the coefficient of determination by using the coefficient of determination formula.
Obs. | X | Y | Xi2 | Yi2 | Xi *Yi |
1 | 2 | 21 | 4 | 441 | 42 |
2 | 4 | 12 | 16 | 144 | 48 |
3 | 3 | 3 | 9 | 9 | 9 |
4 | 34 | 11 | 1156 | 121 | 374 |
5 | 23 | 17 | 529 | 289 | 391 |
Sum = | 66 | 64 | 1714 | 1004 | 864 |
Now, we’ll find the SSxx, SSYY, and SXY:
Step 2: Find the value of the sum of squares of “X” by using the “SSxx” formula.
SSxx = 1714 – 1 /5 * 4356 = 842.8
Step 3: Now, find the value of the sum of squares of “Y” by using the “SSyy” formula.
SSYY = 1004 – 1/ 5 * 4096 = 184.8
Step 4: Evaluate the value sum of products of “X and Y” by using the “SSxy” formula.
SXY = 864- 1/5 *4222 = 19.2
Step 5: Now, put the values in the correlation coefficient (r) formula and find its value.
r = correlation coefficient = SSxy / √ (SSxx × SSyy)
r = 19.2/√ (842.8 ×184.8) = 0.0487
Step 6: Find the value of the coefficient of determination (R2) by taking the square of “r”.
R2= (0.0487)2= 0.0024
To verify the results of the calculated R-squared value, use our above coefficient of determination r2 calculator.
FAQs
What is the formula for the coefficient of determination (R²)?
The R2 value is determined by the regression or correlation formula. The regression formula is: “R2 = 1 -SSE/SST”. The finding r-squared value represents the proportion of the total variation in the dependent variable by independent variable.
Is R2 the same for linear and non-linear regression?
No, “R2” is not the same for linear and non-linear regression. It is only valid for linear regression.
What is the adjusted R2?
The adjusted R2 is a modified version of R² that adjusts the number of predictors or independent variables in a regression model. It gives a more reliable value of goodness of fit by penalizing the unnecessary predictors or variables.
Can R-squared be negative?
No, R squared cannot be negative because it is the square of the correlation coefficient and the square of any value can never be negative. R-squared value always lies between 0 and 1.
Is R2 the only measure of goodness of fit?
No, R2 is not the only measure of goodness of fit. It is a popular metric for linear regression, but it has limitations. However, standard error, MSE, RMSE, and adjusted R2 are considered valuable measures to find the value of goodness of fit.


